top of page


Understanding Displacement-distance and Displacement-Time Graphs of a Longitudinal Wave
For sound waves, the information can be represented on three graphs. Namely: Pressure-distance, Displacement-Distance and Displacement-Time graphs. Since sound waves consist of a series of compressions (high pressure) and rarefactions (low pressure), these information can be represented on a pressure-distance graph. For a displacement-distance graph, you can get the (1) amplitude and (2) wavelength of the sound waves. For a displacment-time graph, you can get the (1) amplitud

Evan Toh
Sep 211 min read
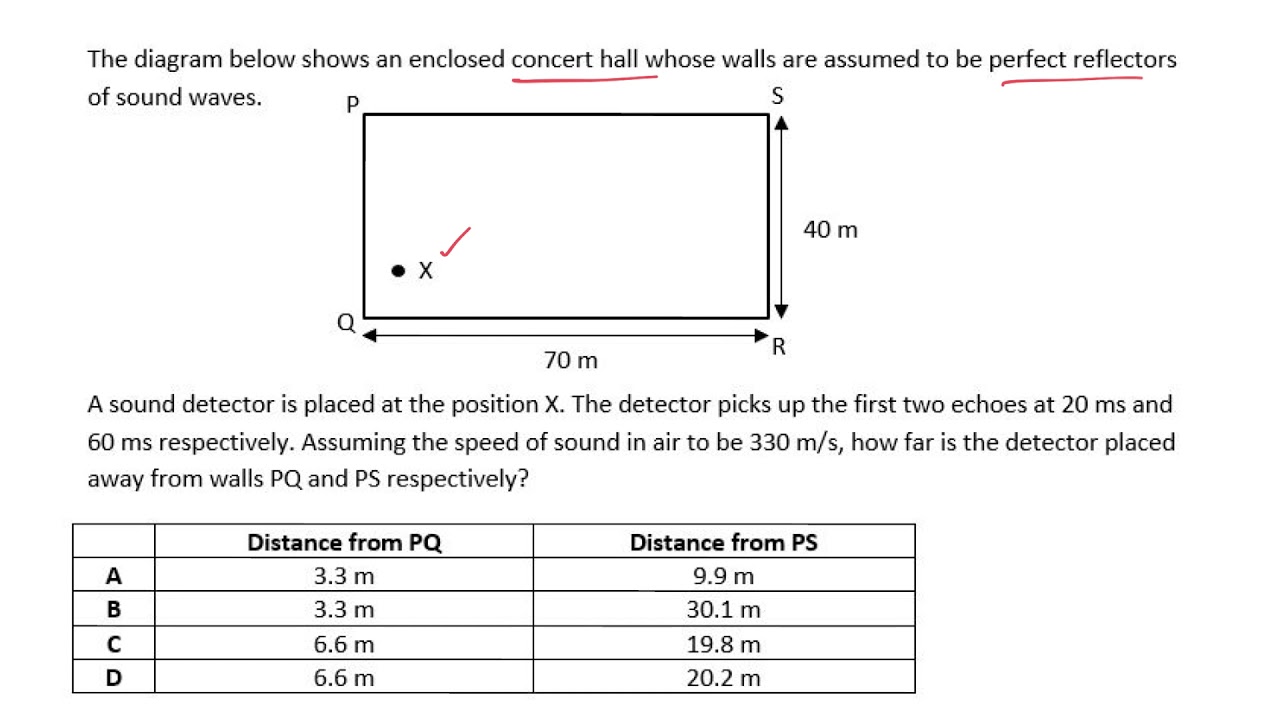
Distance of sound detector from walls
Answer: Option B
Evan Toh
Oct 25, 20241 min read


Light and sound wave diagram in different mediums with different density
Light and sound are both waves. So both carry energy from one place to another. Light , which is part of the electromagnetic spectrum,...
Evan Toh
Oct 1, 20241 min read


Evan Toh
Jan 1, 20240 min read


Evan Toh
Jan 1, 20240 min read
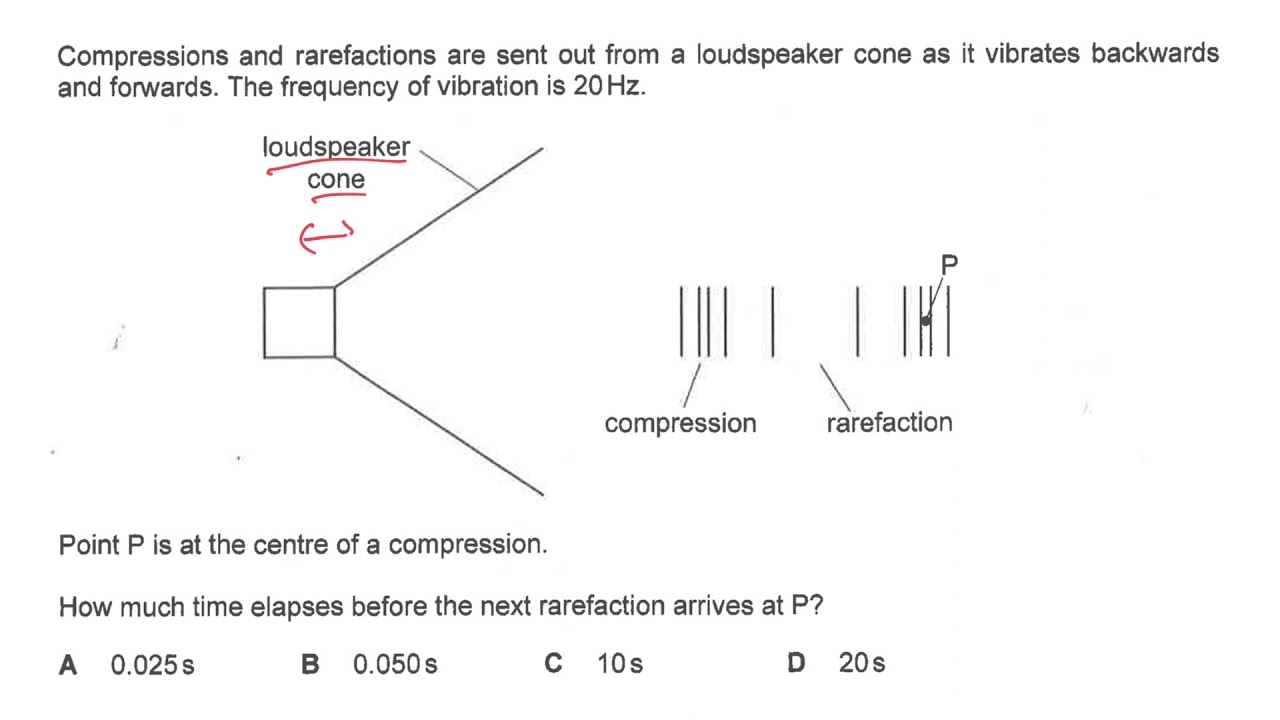
Evan Toh
Jan 1, 20241 min read


Evan Toh
Jan 1, 20240 min read


Time interval between two sounds from a gun – direct and reflected sound
Solutions: Option B You can view the video tutorial here or the written solutions below.
Evan Toh
Jan 1, 20241 min read


Sound – Pitch and Loudness
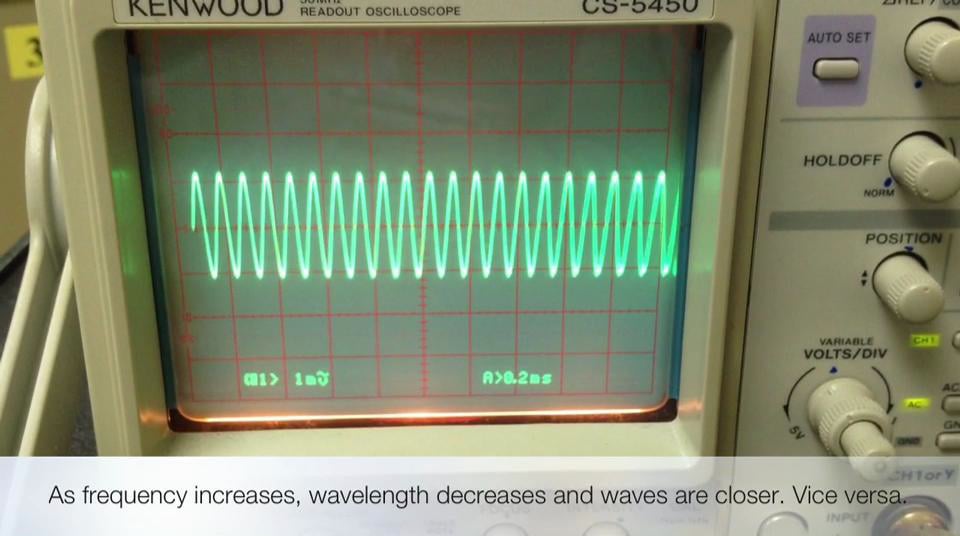
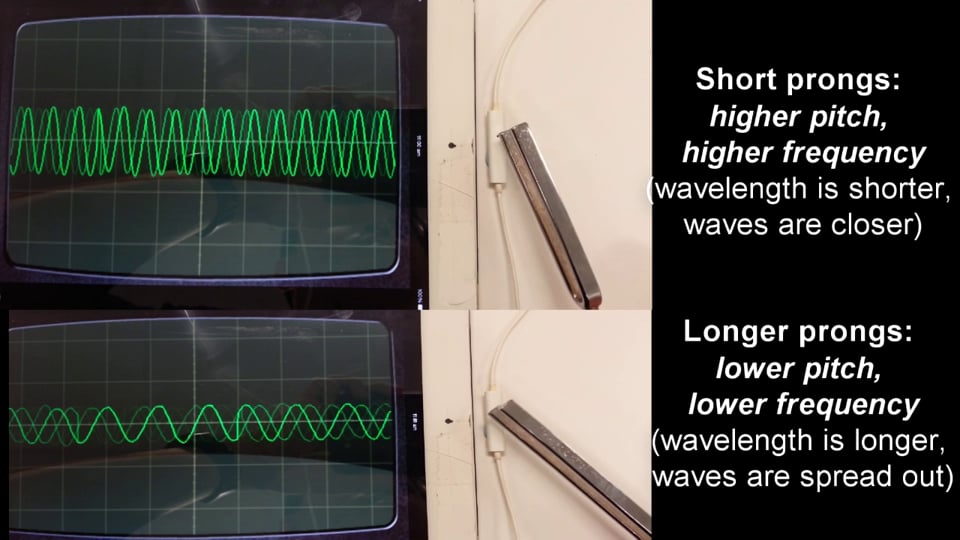
Pitch of the sound depends on the frequency [Higher frequency -> Higher pitch] Loudness of the sound depends on the amplitude [Higher...
Evan Toh
Dec 1, 20231 min read
Evan Toh
Dec 1, 20230 min read


Evan Toh
Dec 1, 20230 min read
Evan Toh
Dec 1, 20230 min read


Evan Toh
Dec 1, 20230 min read

Evan Toh
Dec 1, 20230 min read
bottom of page